

On this page
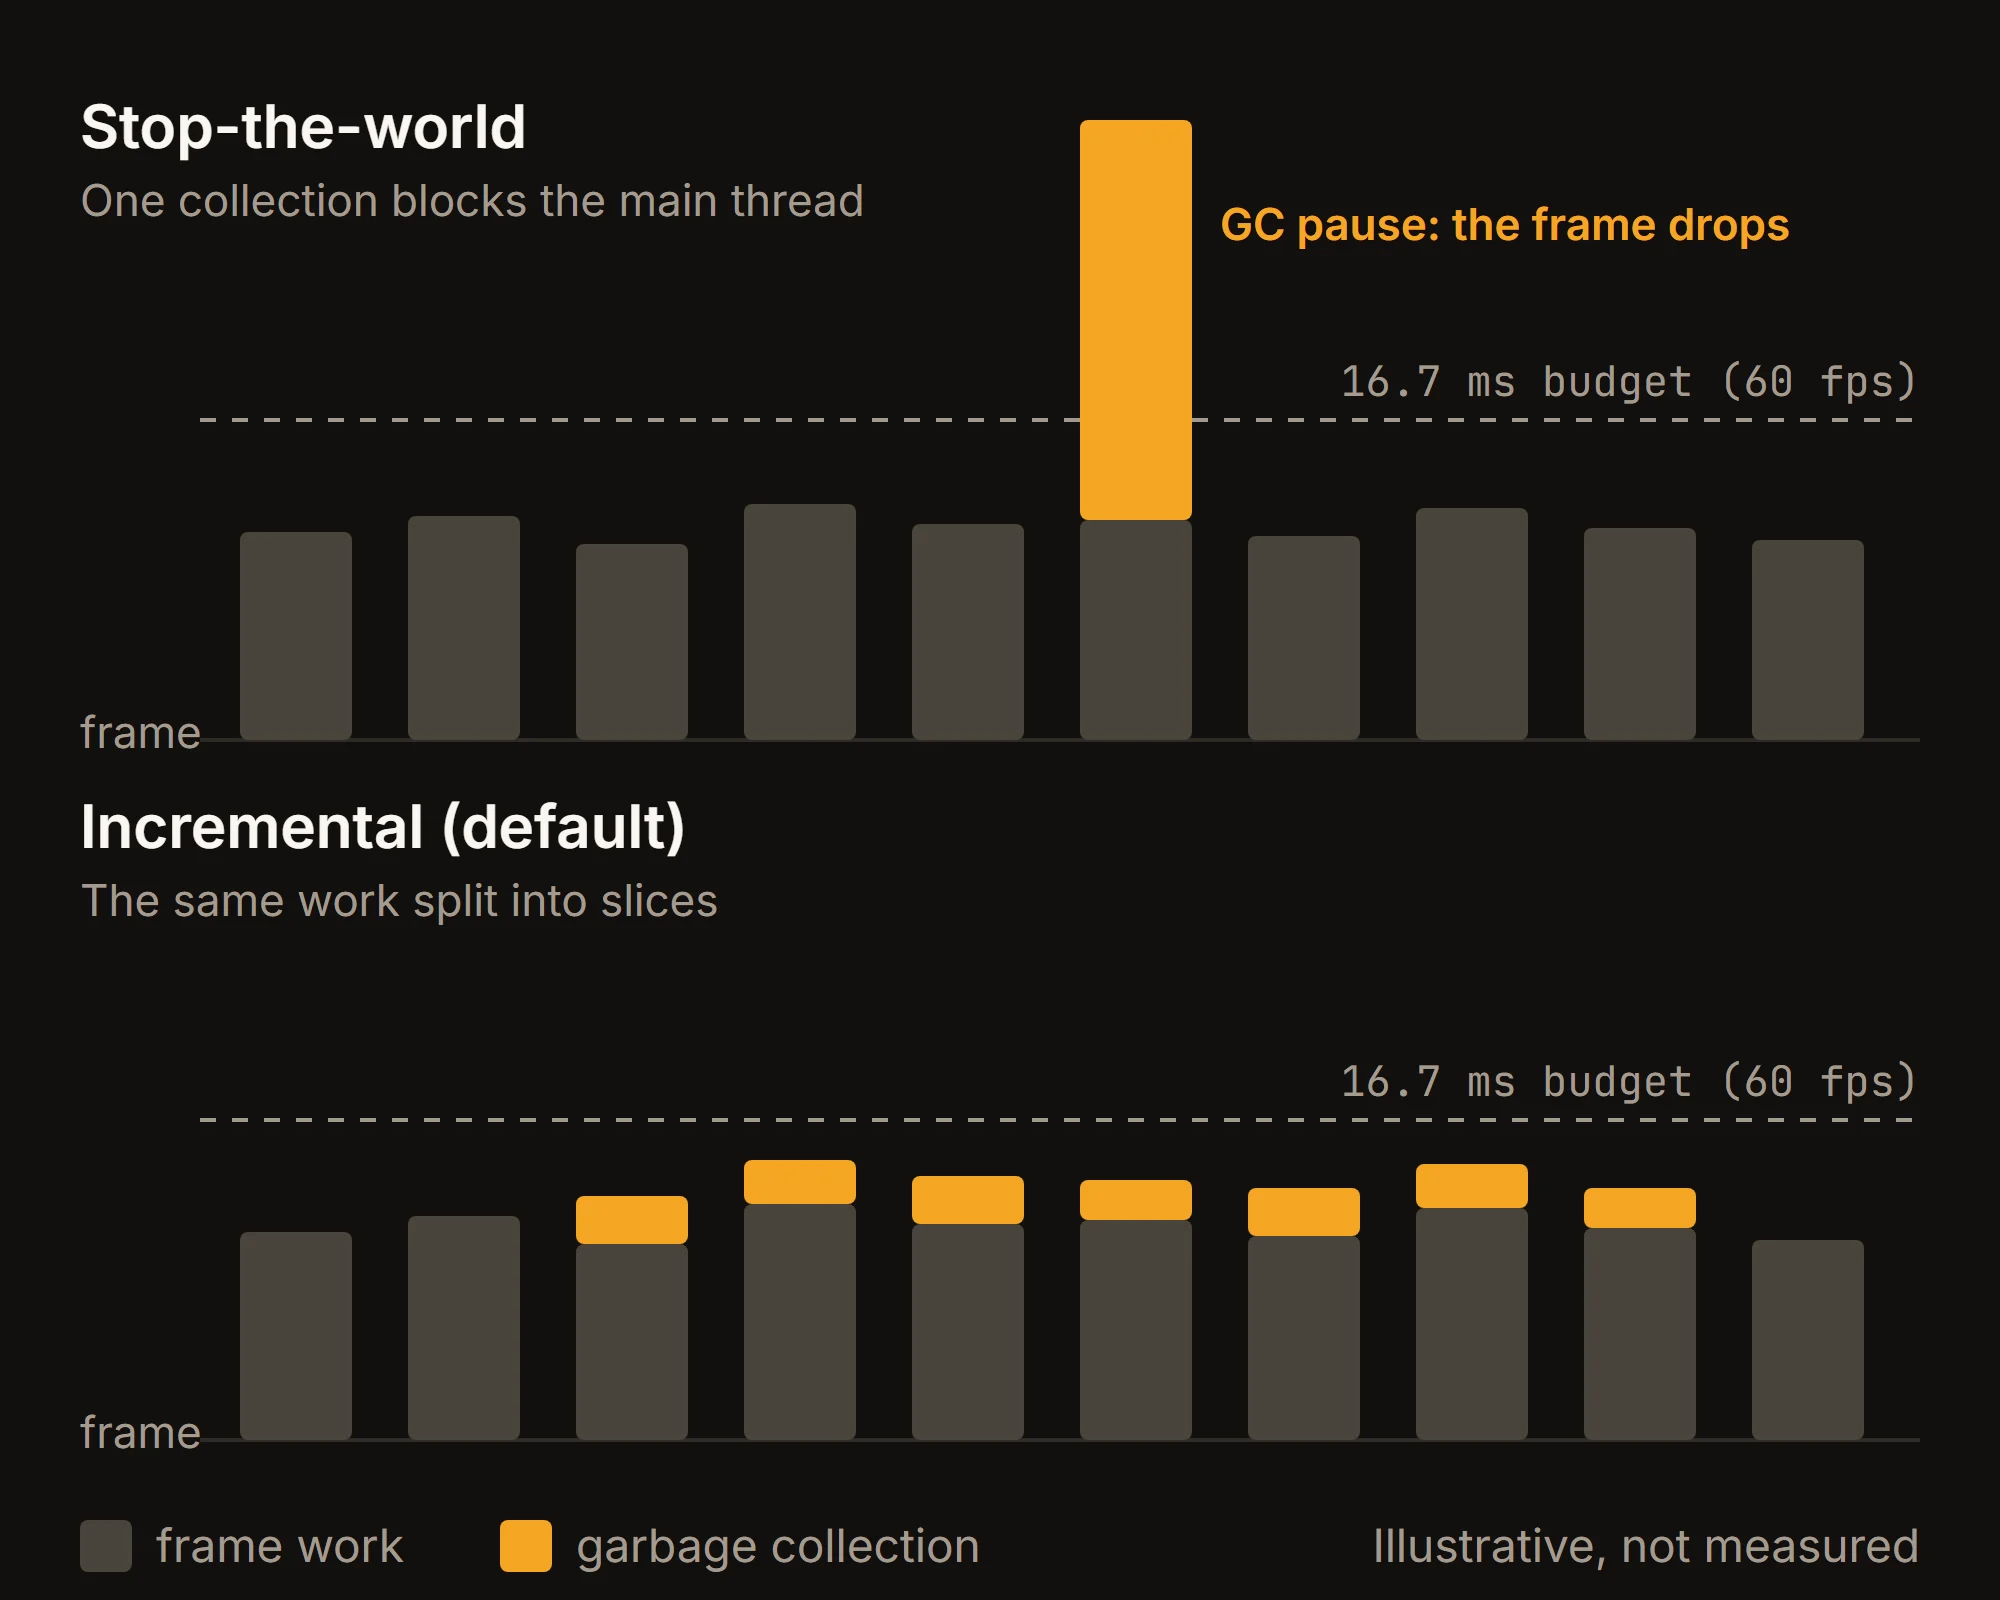
At 60 fps a frame has 16.7 ms, shared by your scripts, rendering and physics. A garbage collection pass that lands in a frame takes time from that budget, and a long one shows up as a visible hitch. In non-incremental mode, Unity says that pause "might last for hundreds of milliseconds".
The fix is rarely a setting. It is knowing where your code allocates managed memory, finding those allocations on the device and removing them from the code that runs every frame. This post covers how the stack and the managed heap work, why the heap fragments, which everyday Unity code allocates, how to find it with the Profiler, and how to fix it.
Sources are the Unity 6 manual and scripting reference, checked against Unity 6.6 in October 2026. Everything applies to the Mono and IL2CPP scripting backends; CoreCLR, still experimental, is covered at the end.
Stack, heap and what the garbage collector manages
C# code works with two kinds of memory. The stack is "a fixed-size memory region allocated at the start of each thread". It holds local variables and the parameters of each method call, and that space is reclaimed as soon as the method returns. The garbage collector never has to look for it.
The managed heap is where everything with an unpredictable lifetime goes. Unity's rule is short: all non-null reference-type objects and all boxed value-type objects are allocated on the managed heap. In practice that means instances of classes, string, arrays, delegates and lambdas.
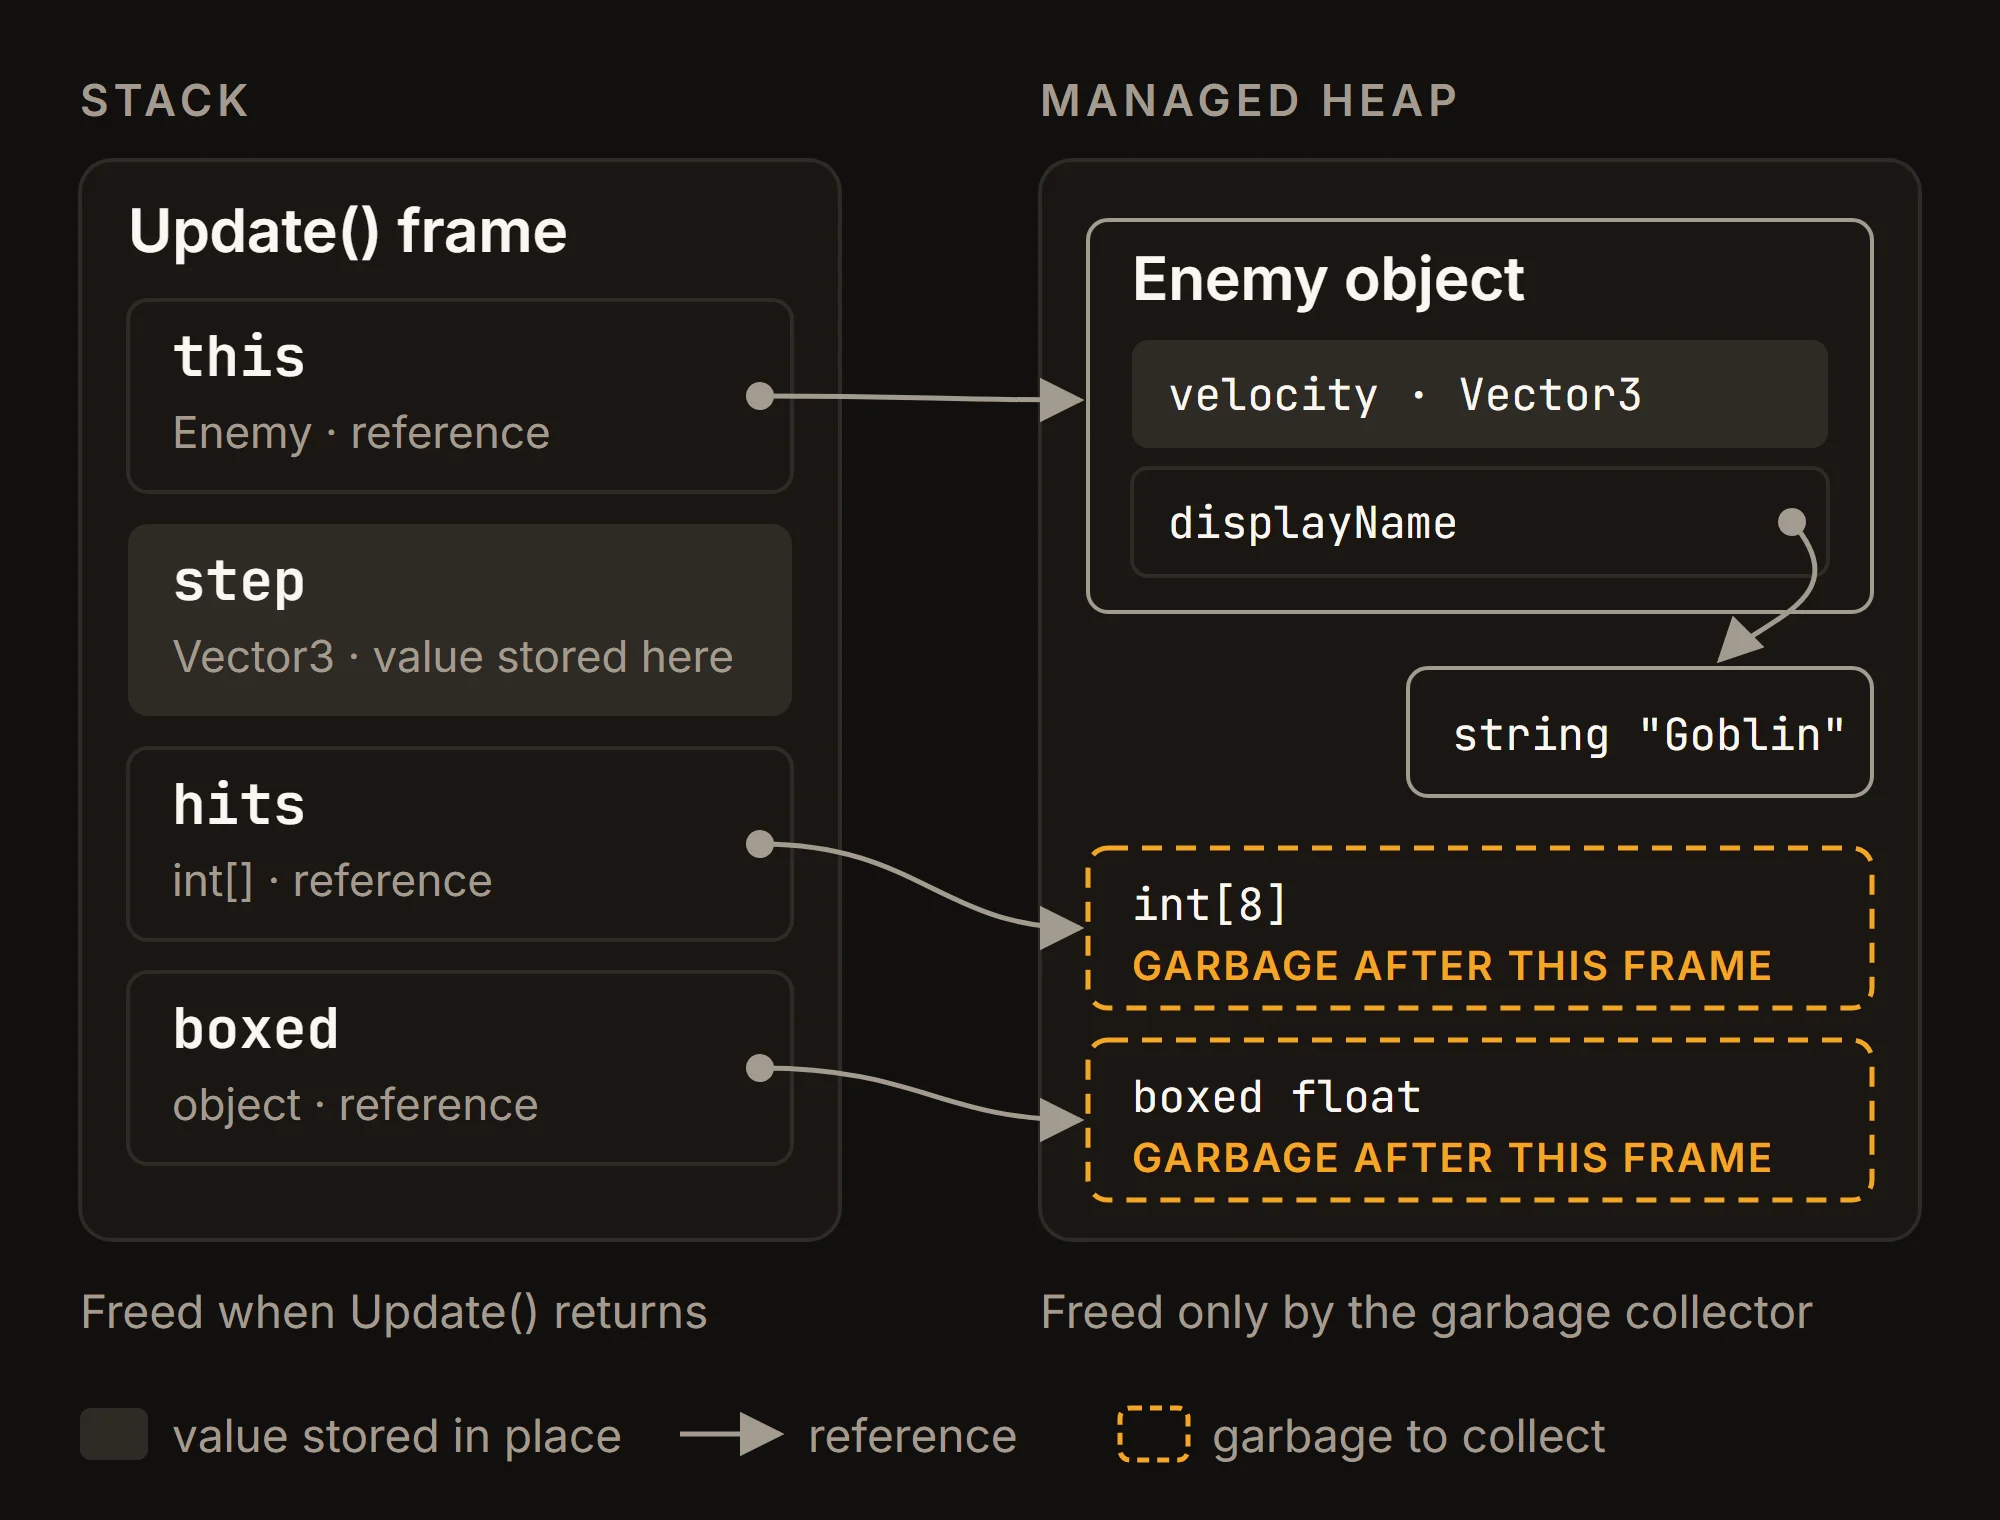
The common shortcut "value types live on the stack" is wrong. A value-type variable contains the instance itself, so a struct lives wherever its variable lives. A local Vector3 is part of the method's stack frame. A Vector3 field of a class is stored inside that object, on the heap.
The comments in this component mark where each value ends up:
public class Enemy : MonoBehaviour
{
    Vector3 velocity;   // inside the Enemy object, on the heap
    string displayName; // a reference to a separate string object

    void Update()
    {
        Vector3 step = velocity * Time.deltaTime; // on the stack
        int[] hits = new int[8];  // a new heap array every frame
        object boxed = step.x;    // boxing: a new heap object
    }
}
The last two lines are what the garbage collector has to clean up later. step costs nothing: it disappears when Update returns.
How Unity's garbage collector works
Unity uses the Boehm–Demers–Weiser garbage collector, on both Mono and IL2CPP. Unity's engineers describe it as a conservative, non-moving collector: it never moves objects once they are allocated.
A collection starts when a script tries to allocate on the managed heap and there isn't enough free memory. The collector marks every object that active references still reach as live, then deletes the rest. Allocations trigger collections, so the more your code allocates, the more often the collector runs.
Stop-the-world vs incremental
Automatic collections run in one of two modes:
- Incremental (the default) spreads the work over multiple frames. With VSync or
Application.targetFrameRate, Unity uses the idle time left at the end of a frame for it. - Non-incremental stops the main CPU thread until the collection is done: one long pause instead of many short slices.
You switch between them with the Incremental GC setting in Project Settings > Player, under Configuration. The Web platform doesn't support incremental collection.
Incremental mode doesn't remove the work; it splits it. If your code allocates heavily, the collector still runs often, and each slice still costs time in the frame.
Heap fragmentation and why the heap only grows
Because Boehm is non-moving, it can't compact the heap. The diagram below and Unity's managed memory page walk through what happens next:
- Objects A, B, C and D are allocated next to each other.
- B and D become garbage and are freed. Their space becomes gaps between live objects, and Unity can only reuse a gap for data of the same size or smaller.
- Your code asks for a large object E. The total free memory would be enough, but no single gap is big enough. The garbage collector runs to try to free contiguous space.
- If there is still no contiguous block large enough, Unity expands the heap and places E in the new space.

The way the heap grows matters on mobile:
- On most platforms, each expansion is double the previous one; the exact amount depends on the platform. An allocation bigger than that gets an out-of-cycle expansion sized to fit it.
- Unity keeps the expanded heap, even when a large part of it is empty, so it doesn't have to expand again for the next large allocation.
- Unity eventually returns empty parts of the heap to the operating system, but the interval "isn't guaranteed and is unreliable", and only whole empty memory pages qualify. Unity gives the page size as usually 4 KB on Windows and macOS and 16 KB on mobile devices.
The heap's virtual memory only grows while the app runs, so one burst of large temporary allocations can raise your footprint for the rest of the session. Allocate large, long-lived buffers once at load time, and keep big temporary arrays out of gameplay code.
What allocates in everyday Unity code
Most garbage comes from a short list of patterns. This Update contains five of them:
void Update()
{
    scoreLabel.text = "Score: " + score; // new string
    Collider[] near = Physics.OverlapSphere(
        transform.position, radius);     // new array
    var alive = enemies.Where(e => e.IsAlive) // System.Linq
        .ToList();                       // LINQ and a new List
    StartCoroutine(Flash());             // new state machine
}

IEnumerator Flash()
{
    yield return new WaitForSeconds(0.1f); // new object per call
}
Strings
Strings are immutable, so concatenation and interpolation create a new string each time. Unity recommends avoiding temporary strings, using StringBuilder when you build text from many parts, and updating UI text only when the value changes. Logging is part of this: Debug.Log calls aren't stripped from release builds, and C# evaluates the arguments before the call, so the message string is still built in release players.
Boxing and params
Boxing copies a value type into a new heap object whenever it is passed as object or as an interface. Unity calls it "one of the most common sources of unintended temporary memory allocations" in Unity projects, and compilers don't warn about it. Methods with a params parameter allocate an array on every call; use an overload without it when there is one.
Closures, delegates and LINQ
A lambda that captures a local variable needs an instance of a compiler-generated class each time it runs, and method references are heap objects too. LINQ adds both: Unity's programming best practices note that System.Linq methods "can create unnecessary allocations and involve boxing and closures". Keep them out of per-frame code.
Unity APIs that return arrays
"All Unity APIs that return arrays create a new copy of the array each time they're accessed": Physics.RaycastAll, Mesh.vertices, Input.touches, Renderer.sharedMaterials and others. Renderer.materials goes further and instantiates the materials, which you then have to destroy yourself.
Coroutines, Instantiate and Destroy
On Unity's coroutines page, yield return null doesn't allocate, but new WaitForSeconds does. Each coroutine also creates an IEnumerator state machine, so starting coroutines every frame allocates. The same goes for spawning: creating and destroying objects over and over is the overhead object pooling exists to remove.
Finding allocations with the Profiler
Measure before you change code, and measure on the device. In the Editor, results differ: GetComponent always allocates in the Editor, but not in a built project.
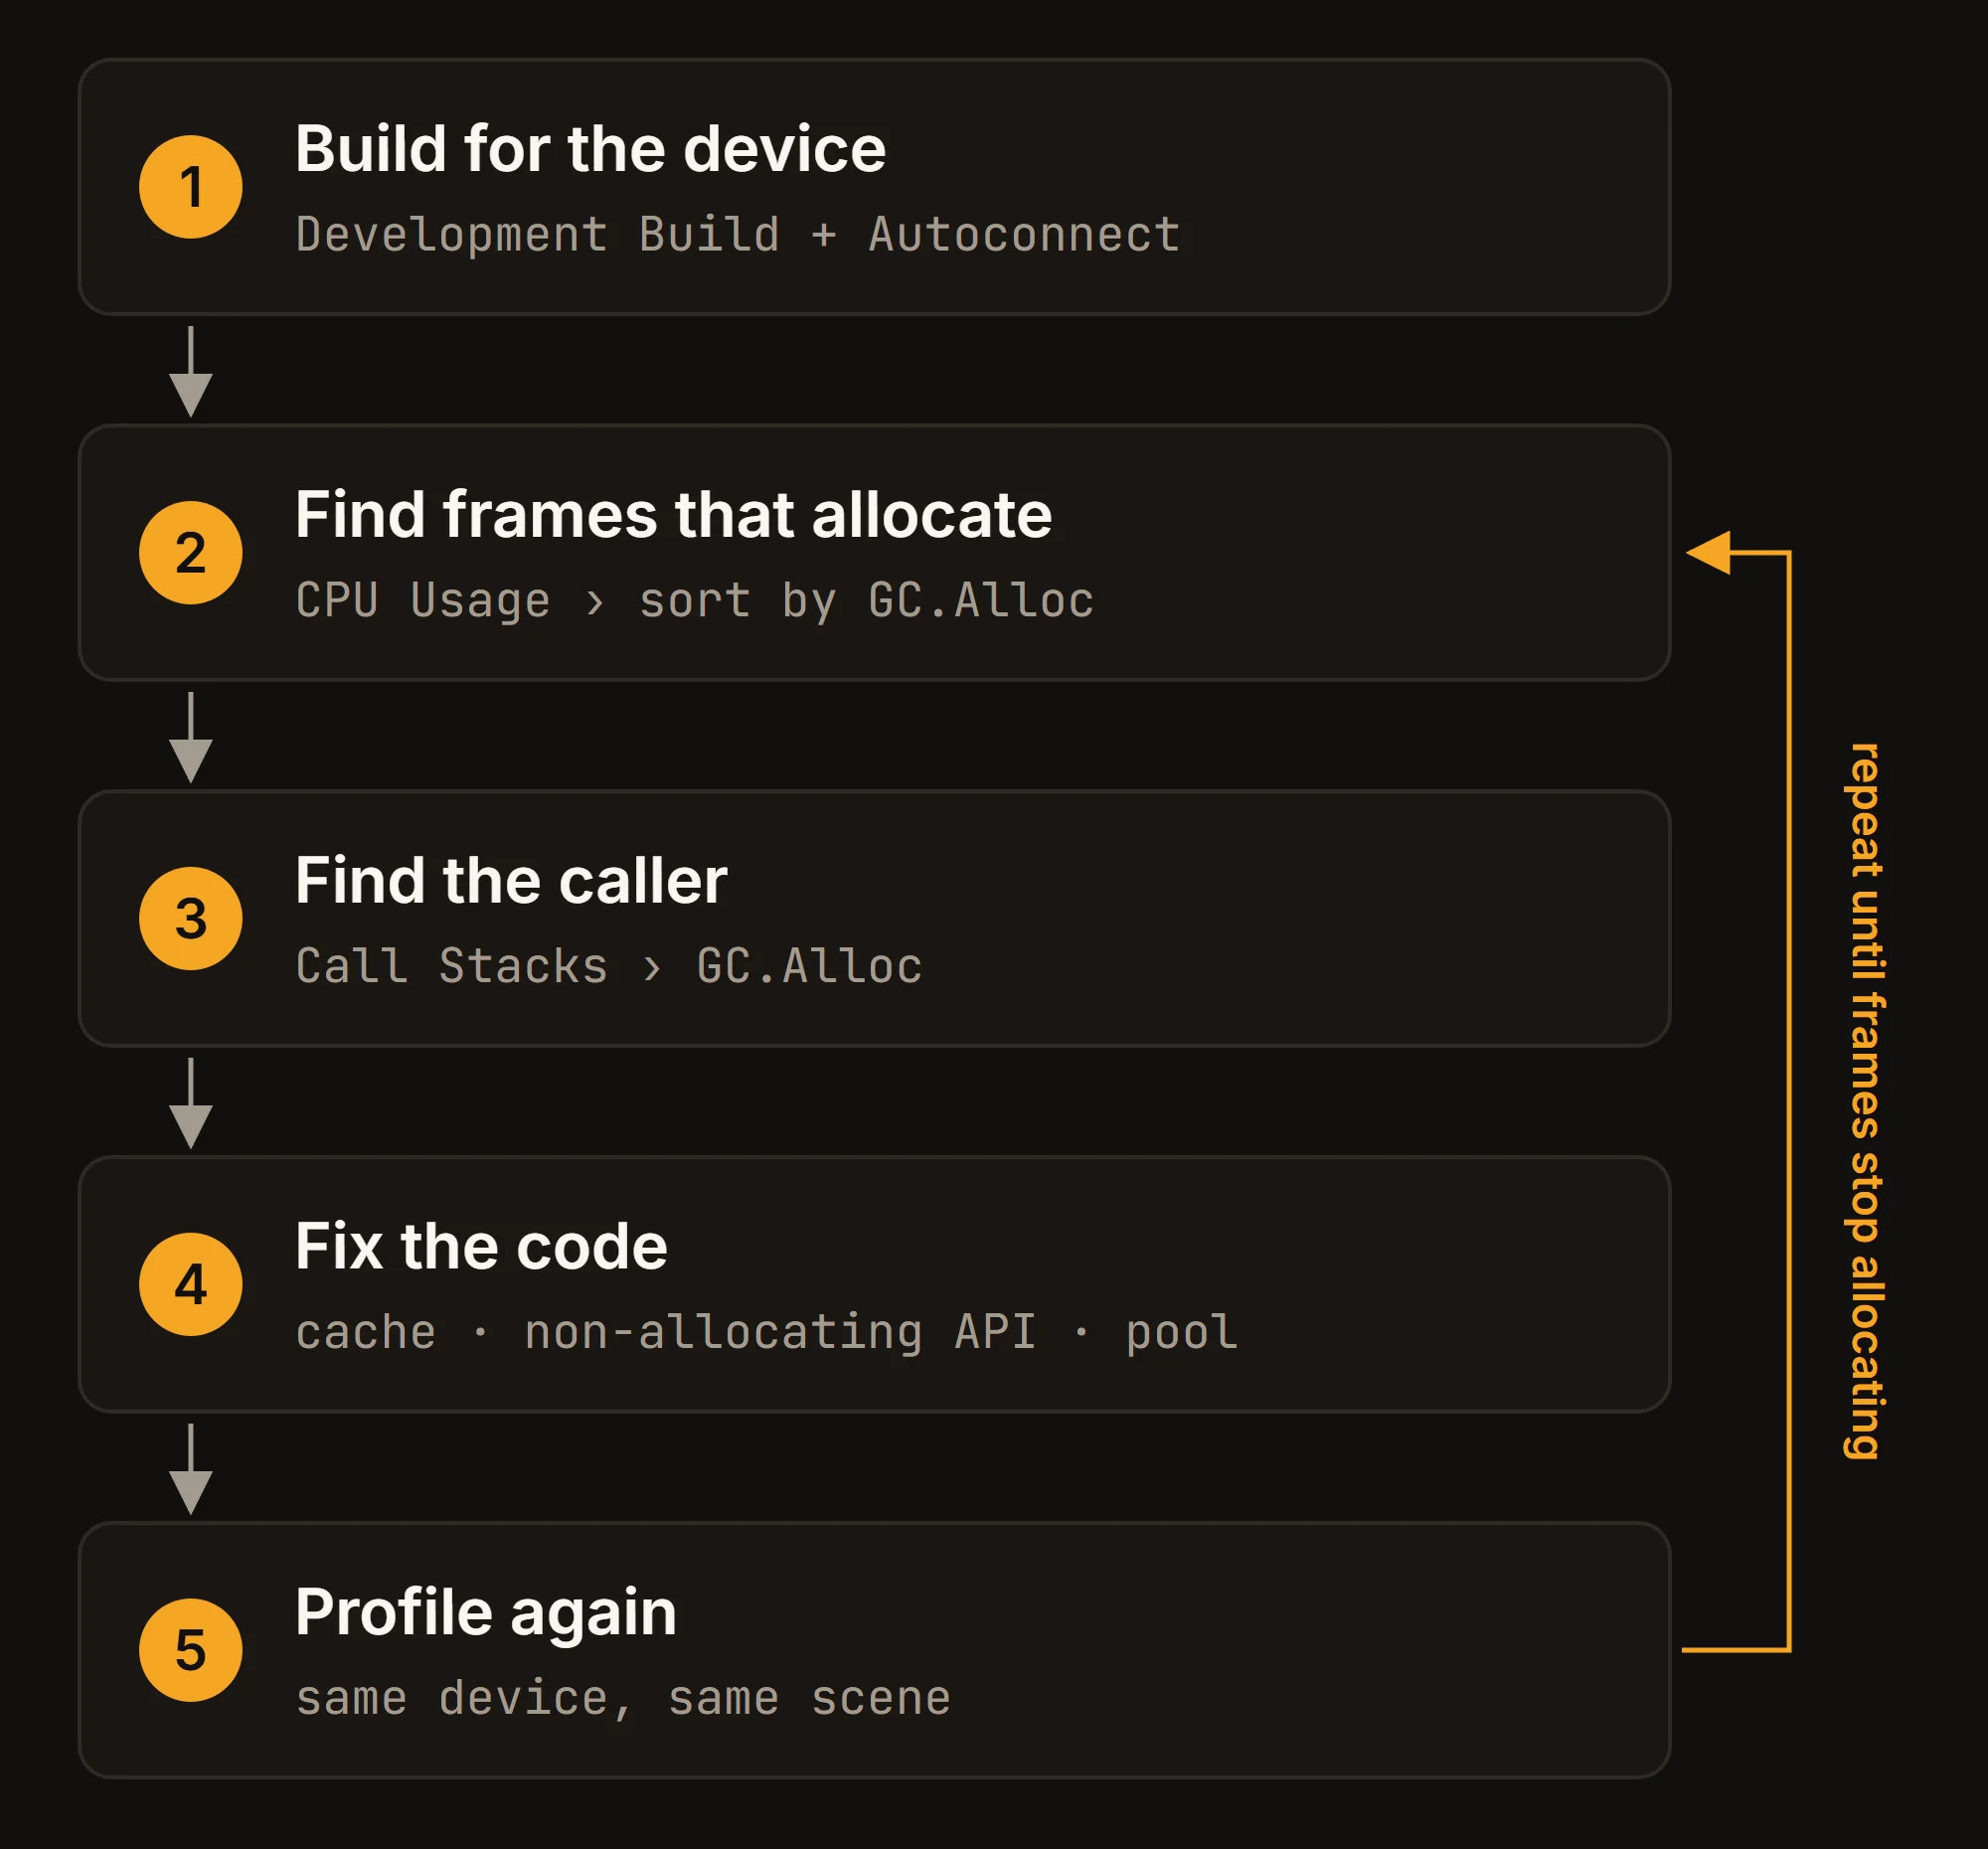
- Build for the device. In File > Build Profiles, enable Development Build and, optionally, Autoconnect Profiler, then use Build and Run. If the Profiler doesn't connect, pick the device from the target selection dropdown next to Record.
- Find frames that allocate. In the CPU Usage module, select a frame and open the Hierarchy view. The GC.Alloc column shows the bytes allocated on the managed heap in that frame and thread. Sort by it.
- Find the caller. In the Profiler toolbar, set Call Stacks to GC.Alloc. Unity then records full call stacks for managed allocations, without the overhead of Deep Profiling.
- Watch the trend. The Memory module shows GC Allocated In Frame and GC Used Memory. Its per-frame number can be higher than the GC.Alloc column, because it counts all threads and Editor-only samples.
- Inspect the heap. For a detailed view of memory at a specific point in time, use the Memory Profiler package.
Track allocations from code
To keep an eye on allocations outside the Profiler window, read the same counters in code with ProfilerRecorder. This component logs a warning for any frame that allocates (the warning's own string only allocates on frames that already did):
using Unity.Profiling;
using UnityEngine;

public class AllocationWatcher : MonoBehaviour
{
    ProfilerRecorder allocatedInFrame;

    void OnEnable() => allocatedInFrame = ProfilerRecorder.StartNew(
        ProfilerCategory.Memory, "GC Allocated In Frame");

    void OnDisable() => allocatedInFrame.Dispose();

    void Update()
    {
        long bytes = allocatedInFrame.LastValue;
        if (bytes > 0)
            Debug.LogWarning($"[AllocationWatcher] GC allocated in frame: {bytes}");
    }
}
The counters reference lists GC Allocated In Frame as unavailable in release players, so use it in development builds. GC Used Memory and GC Reserved Memory are available everywhere.
Fixing the common cases
Cache and reuse
Most fixes follow one rule: allocate once, reuse every frame. Here is the Update from earlier without the per-frame garbage:
readonly Collider[] near = new Collider[32];
readonly List<Enemy> alive = new List<Enemy>();
readonly WaitForSeconds flashDelay = new WaitForSeconds(0.1f);
int shownScore = -1;

void Update()
{
    if (score != shownScore)
    {
        scoreLabel.text = "Score: " + score; // only on change
        shownScore = score;
    }
    int count = Physics.OverlapSphereNonAlloc(
        transform.position, radius, near); // near[0..count) is valid
    alive.Clear();
    foreach (Enemy e in enemies) // enemies is a List<Enemy>
        if (e.IsAlive) alive.Add(e);
}
The cached flashDelay replaces new WaitForSeconds inside Flash, which Unity's coroutine page recommends for fixed durations. Better still, run one long-lived coroutine that loops instead of starting a new one per event. For text that changes every frame, Unity suggests TextMeshPro's SetText(char[]) with a reused buffer.
Non-allocating API variants
Unity's rule of thumb is that an API returning an array usually has a non-allocating version:
Physics.RaycastAll→Physics.RaycastNonAllocPhysics.OverlapSphere→Physics.OverlapSphereNonAllocGetComponents<T>()→GetComponents<T>(List<T>)Mesh.vertices→Mesh.GetVertices(List<Vector3>)Renderer.sharedMaterials→Renderer.GetSharedMaterialsInput.touches(Input Manager) →Input.touchCountandInput.GetTouch(i)
Size the buffers for the worst case. A NonAlloc query stops when the buffer is full, and then the results aren't guaranteed to be the closest hits.
Object pooling with ObjectPool<T>
For objects you spawn and despawn often (bullets, effects, UI rows), Unity ships UnityEngine.Pool. ObjectPool<T> takes the callbacks that create, take, return and destroy an item:
using UnityEngine;
using UnityEngine.Pool;

public class BulletSpawner : MonoBehaviour
{
    [SerializeField] Bullet bulletPrefab;
    ObjectPool<Bullet> pool;

    void Awake() => pool = new ObjectPool<Bullet>(
        createFunc: () => Instantiate(bulletPrefab),
        actionOnGet: b => b.gameObject.SetActive(true),
        actionOnRelease: b => b.gameObject.SetActive(false),
        actionOnDestroy: b => Destroy(b.gameObject),
        collectionCheck: true,
        defaultCapacity: 32,
        maxSize: 256);

    public Bullet Spawn() => pool.Get();
    public void Despawn(Bullet bullet) => pool.Release(bullet);
}
collectionCheck catches double releases, but only in the Editor. Items released while the pool already holds maxSize go to actionOnDestroy. For temporary lists, ListPool<T> does the same: Get() a list, use it, then Release(list). In async code, Unity 6's Awaitable instances are pooled, so calling an Awaitable method usually doesn't allocate.
NativeArray for large data
For arrays with more than about 10,000 elements, Unity suggests the Unity.Collections types such as NativeArray<T>. A NativeArray<T> is a fixed-size block of unmanaged memory, outside the managed heap, and unmanaged memory is what the job system and Burst need. In exchange you control allocation and disposal yourself: call Dispose() when you are done.
Tuning the collector itself
Keep incremental GC on. Two settings let you shape it:
GarbageCollector'sincrementalTimeSliceNanosecondssets the target length of one slice. The default is 3 ms; setting it too short can be counterproductive.- Incremental mode has a cost of its own. Unity adds write barriers to track reference changes, and if references change too fast for the collector to finish marking, it falls back to a full, non-incremental collection.
For a section with predictable memory use, such as one level, you can take control with GarbageCollector.GCMode:
Mode.Disabledturns the collector off completely. If your code keeps allocating, memory use keeps growing.Mode.Manualstops automatic collections. Per Configuring garbage collection,System.GC.Collect()then runs a full, blocking collection andGarbageCollector.CollectIncremental()runs an incremental one.
A typical pattern collects once at a load boundary, switches to manual mode for the level, and switches back at the next safe point:
using UnityEngine.Scripting;

// End of the loading screen: collect once, then stop automatic runs.
System.GC.Collect();
GarbageCollector.GCMode = GarbageCollector.Mode.Manual;

// At the next safe point (results screen, next load):
GarbageCollector.GCMode = GarbageCollector.Mode.Enabled;
GCMode isn't supported in the Editor or on WebGL, so test it in a player build. It only helps once per-frame allocations are near zero; otherwise the heap keeps growing until the next safe point.
What changes with CoreCLR
Unity is moving its scripting runtime to CoreCLR, whose garbage collector is precise and moving instead of conservative and non-moving. In the Unity 6.7 beta, the CoreCLR backend is experimental, desktop-only and "not suitable for production use", and it brings a generational collector. For mobile projects today, everything above still applies.
Checklist
- Profile a development build on the device, not the Editor.
- Sort the CPU Usage hierarchy by GC.Alloc and set Call Stacks to GC.Alloc to find the caller.
- Make per-frame code allocation-free: cache strings, buffers, lists and
WaitForSeconds, and update UI only on change. - Replace array-returning APIs with their non-allocating variants, and keep LINQ, closures, boxing and
paramsout of hot paths. - Pool anything you spawn repeatedly with
ObjectPool<T>. - Allocate large, long-lived buffers at load time; use
NativeArray<T>for very large data. The managed heap rarely shrinks. - Keep incremental GC on, and use
GCMode.Manualonly for bounded sections after allocations are under control.