
On this page
A player opens your game, plays for ten minutes and the game disappears. For the player, that is one event. Android sees one of three: a crash, an ANR or a memory kill. Each one has a different cause, and each leaves a different report, or none at all.
This post covers what causes each of the three on Android, where Unity adds its own failure points, how to get a readable report for each, and how to fix the most common causes. It is written for developers who already ship Unity games to Android.
Written for Unity 6 (6000.0 LTS and later) against the Android, Google Play and Unity documentation as of October 2026. Android API levels are named where behavior changes.
Three ways a game stops on Android
A crash means your code, or code you ship, did something the process cannot survive. That is an uncaught Java or Kotlin exception, or a native signal such as SIGSEGV. Either way, you get a crash report with a stack trace.
An ANR (Application Not Responding) is about time, not errors. In Google's words, "when the UI thread of an Android app is blocked for too long", the system raises an ANR. In the foreground, the player sees a dialog that lets them force quit the app. Android also stores an ANR trace for you to read later.
A memory kill happens when the device runs short of memory. Android's low memory killer ends the process from outside, so your app writes no crash report. Google describes the result plainly: "To the end user, it looks like the app crashed".
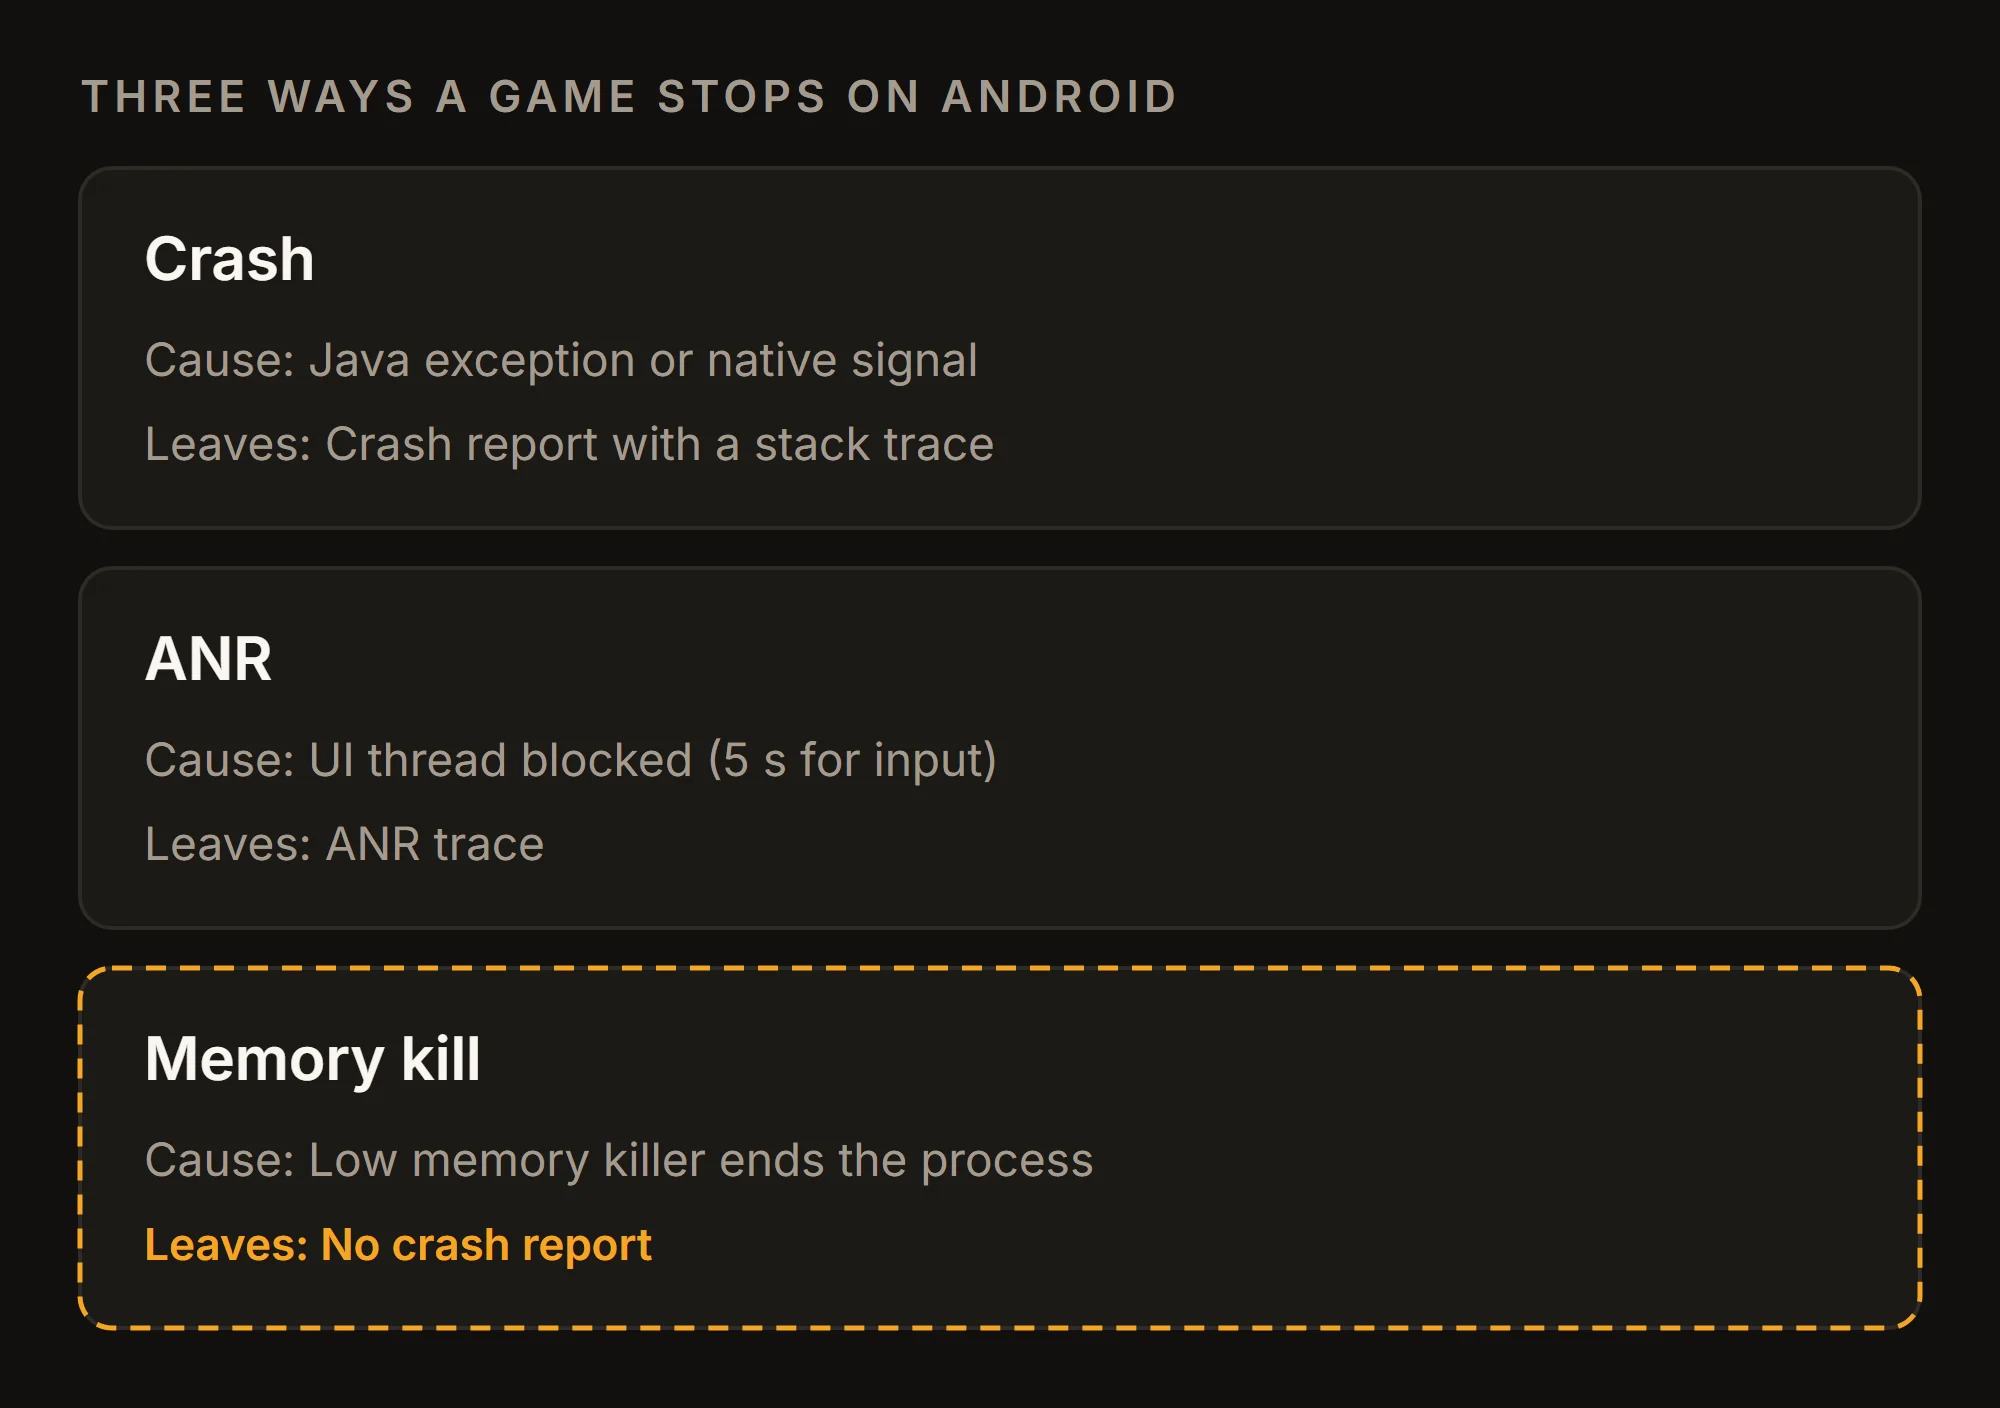
The last case matters most for games. They use a lot of memory, and a memory kill never appears in your crash list.
How Google Play measures stability
Google Play turns these events into Android vitals with bad behavior thresholds. Both metrics count daily users who had at least one user-perceived event:
- User-perceived crash rate: at least 1.09% of daily users across all device models, or at least 8% on a single device model.
- User-perceived ANR rate: at least 0.47% of daily active users across all device models, or at least 8% on a single device model.
Play generally looks at the last 28 days, but "may act sooner in the event of a spike". An app over a threshold is "likely to be less discoverable on Google Play". For a device-specific problem, Play steers users on that device away from the app, and in some cases the store listing shows a warning.
Memory kills have their own metric. Google's games documentation defines a user-perceived LMK rate and says that "an LMK rate above 1% indicates a critical need for immediate action".
Crashes: exceptions and native signals
A Unity game runs code in three places: C# compiled by IL2CPP into native code, the native engine, and Java or Kotlin in plug-ins and SDKs. Each of them can crash the process.
Java and Kotlin exceptions
Ads, analytics, billing and login SDKs usually include Java or Kotlin code, and so does a custom activity. When an exception there goes uncaught, Android terminates the process and shows the "app has stopped" dialog. The same page says null pointer exceptions are "the largest cause" of crashes on Google Play. The report gives you the exception type and the line that threw it, which is usually enough.
Native signals and tombstones
Crashes in libunity.so, libil2cpp.so or a native plug-in arrive as signals. Android's debuggerd writes the crash to logcat and to a tombstone: backtraces for all threads, memory around the fault and the memory map. The same page shows how the common types look:
- Abort:
SIGABRTfromabort(), a failedassert()or fatal logging. Read the abort message first. - Null pointer:
SIGSEGVat address0x0or another low address. - FORTIFY: an abort with a message such as "prevented 32-byte write into 10-byte buffer".
- Stack corruption:
SIGABRTwith "stack corruption detected".
Making crash reports readable
Release builds are stripped, so a native stack without symbols is a list of addresses. Symbols are the files that map those addresses back to function names. You have to produce them for every build and upload them for every release.
On Android, Unity creates them for you. In File > Build Profiles, set Debug Symbols to Public (a symbol table) or Debugging (full debug information), and Symbols output options to .zip. The build then writes a file named like MyApp-0.1-v100-IL2CPP.symbols.zip, with symbols for libmain, libunity and libil2cpp. Upload it to that release in Play Console. Unity's page warns that "Google Play doesn't symbolicate crashes that your application received before you uploaded the symbols package".
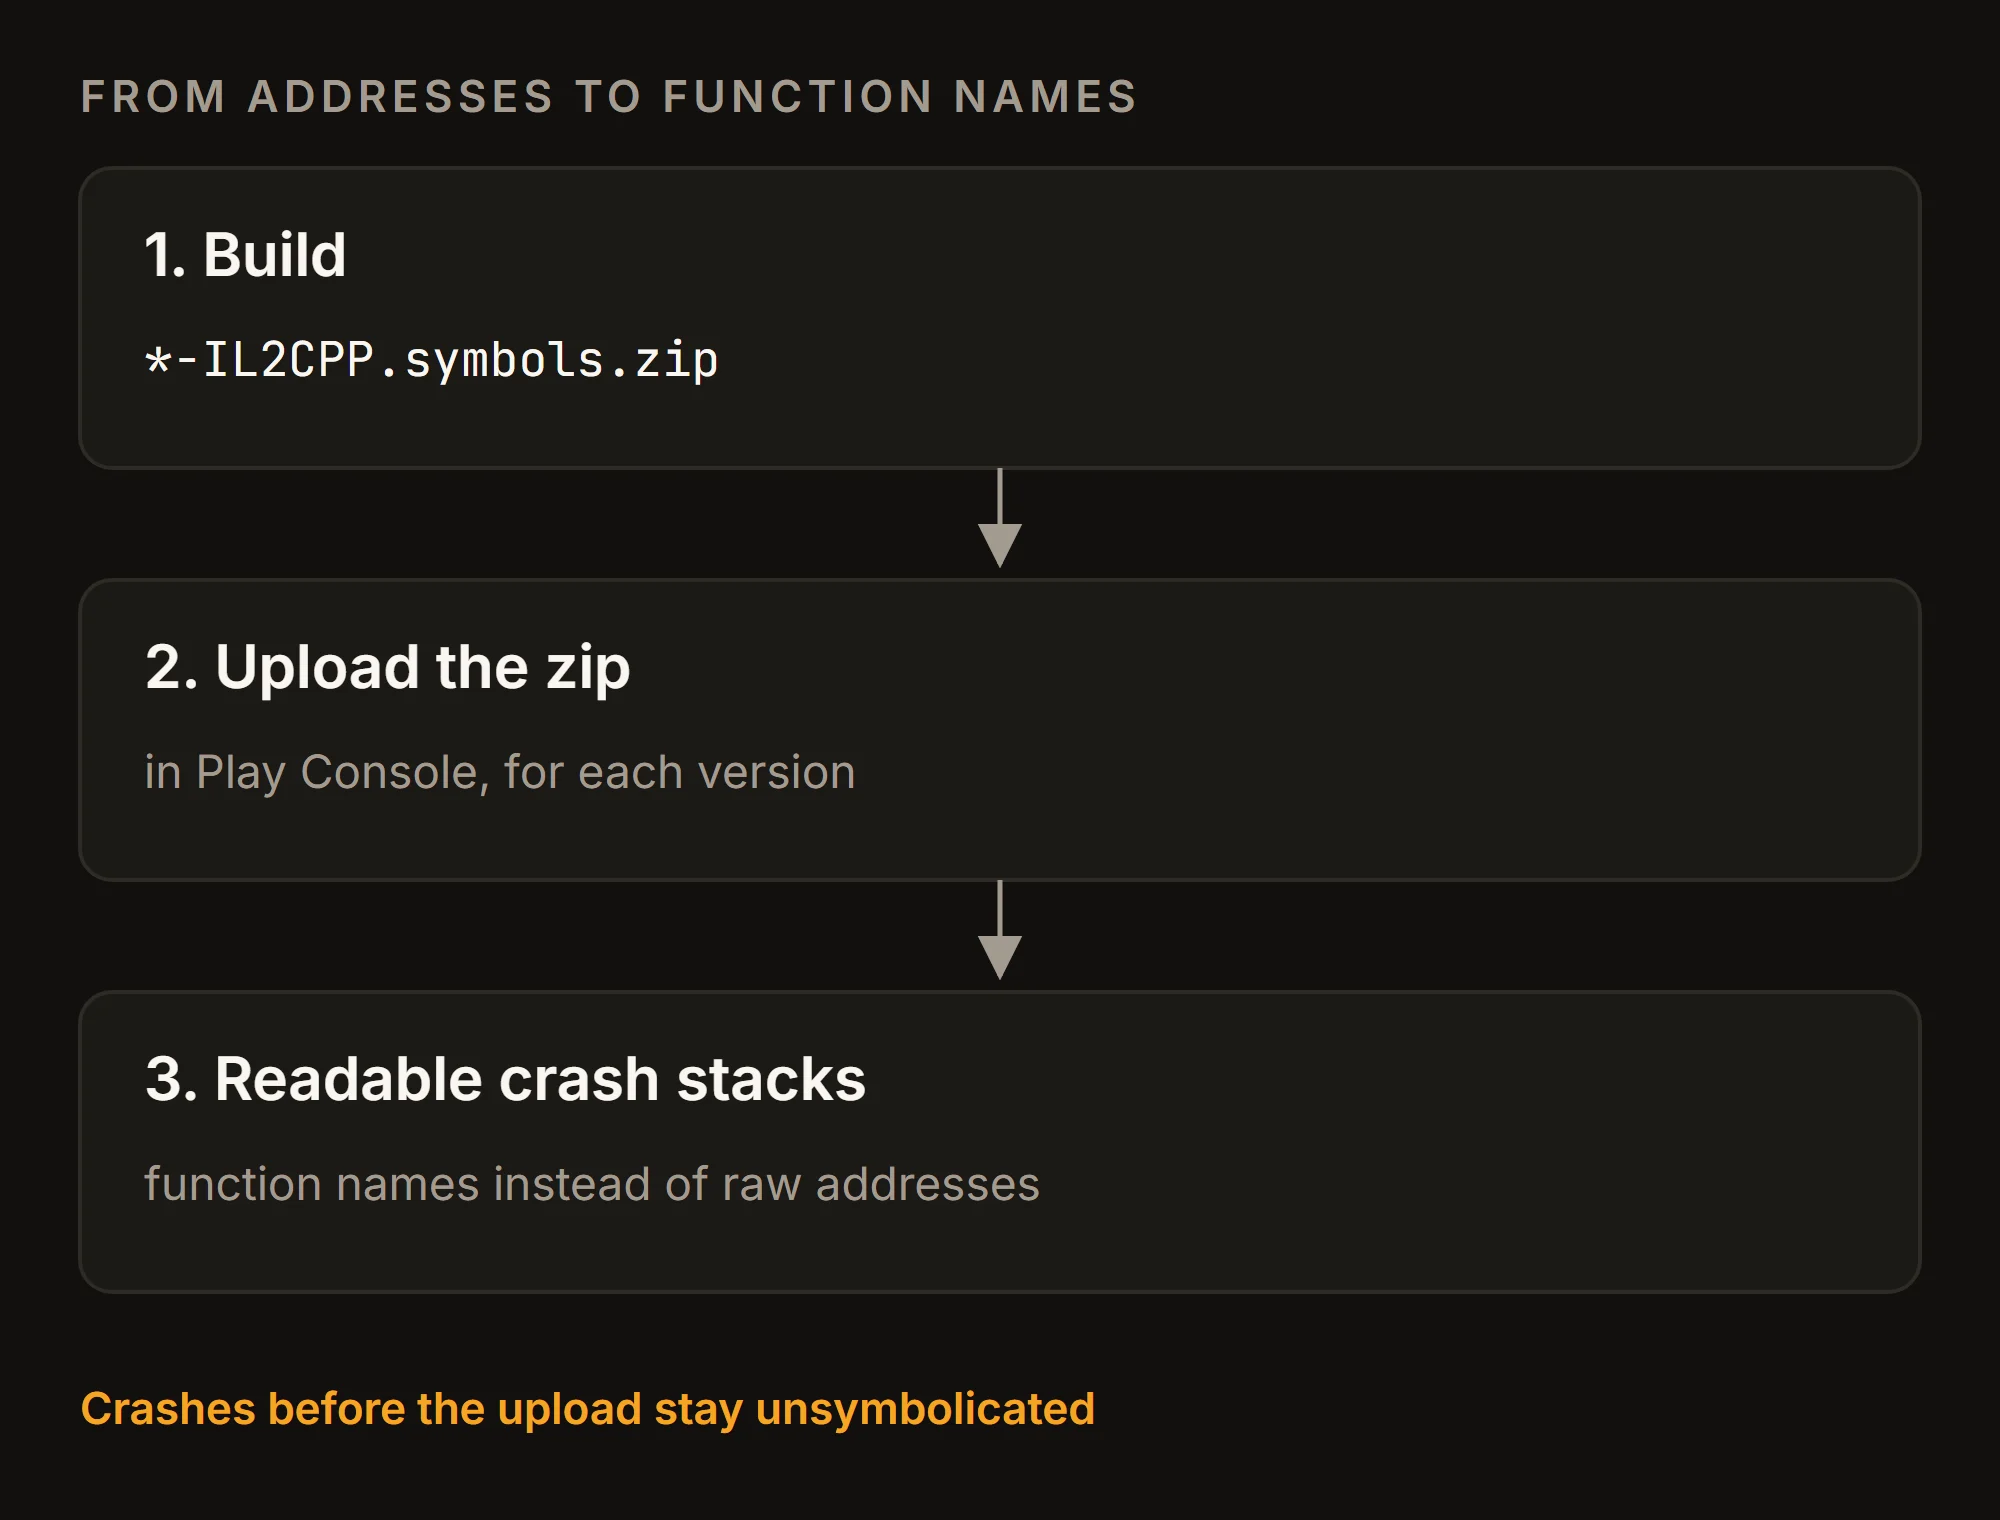
A symbol file only works with the exact binary it was built with. Google's Unity ANR guide checks this with the build ID:
readelf -n libil2cpp.so | grep 'Build ID'Compare the ID in your symbols with the one in the crash report. To symbolicate a logcat or tombstone yourself, ndk-stack takes a folder of unstripped libraries, and Play Console uses the same tool.
One more setting decides how much a managed stack tells you. In Release builds, the C++ compiler can inline managed methods, which drops them from the stack. Set IL2CPP Stacktrace Information to "Method Name, File Name, and Line Number" in Player > Other Settings. It slightly increases build time and build size.
If you use Unity's own reporting, Diagnostics (Unity 6.2 and later) collects crashes, exceptions and, on Android 11 and later, ANRs.
ANR: a blocked UI thread
An ANR means the UI thread, which handles input and lifecycle events, stopped responding for longer than a fixed timeout. Which timeout applies depends on what the thread was asked to do.
ANR timeouts
Android's diagnosis guide lists the timeouts for AOSP and Pixel devices (other manufacturers can differ):
- Input dispatch: 5 seconds without handling an input event.
- Broadcast receiver: 10 seconds for a foreground intent, 60 seconds for a background one. Android 14 can stretch these to 10–20 and 60–120 seconds when the CPU is starved.
- Service: 20 seconds in the foreground, 200 seconds in the background.
For a game, input dispatch matters most: Play currently counts only "input dispatching timed out" ANRs in the user-perceived ANR rate. The common causes are slow I/O or long calculations on the main thread, a synchronous binder call to a slow process, waiting on a lock held by another thread, and deadlocks.
Where Unity blocks the UI thread
Unity's player loop does not run on Android's UI thread. With the Activity entry point, it runs on a separate Java thread. With GameActivity, the default for new projects, it runs on a native thread. ANRs in Unity games come from the moments when the UI thread waits for the engine, or does slow work of its own. Google's list of common Unity ANRs names four:
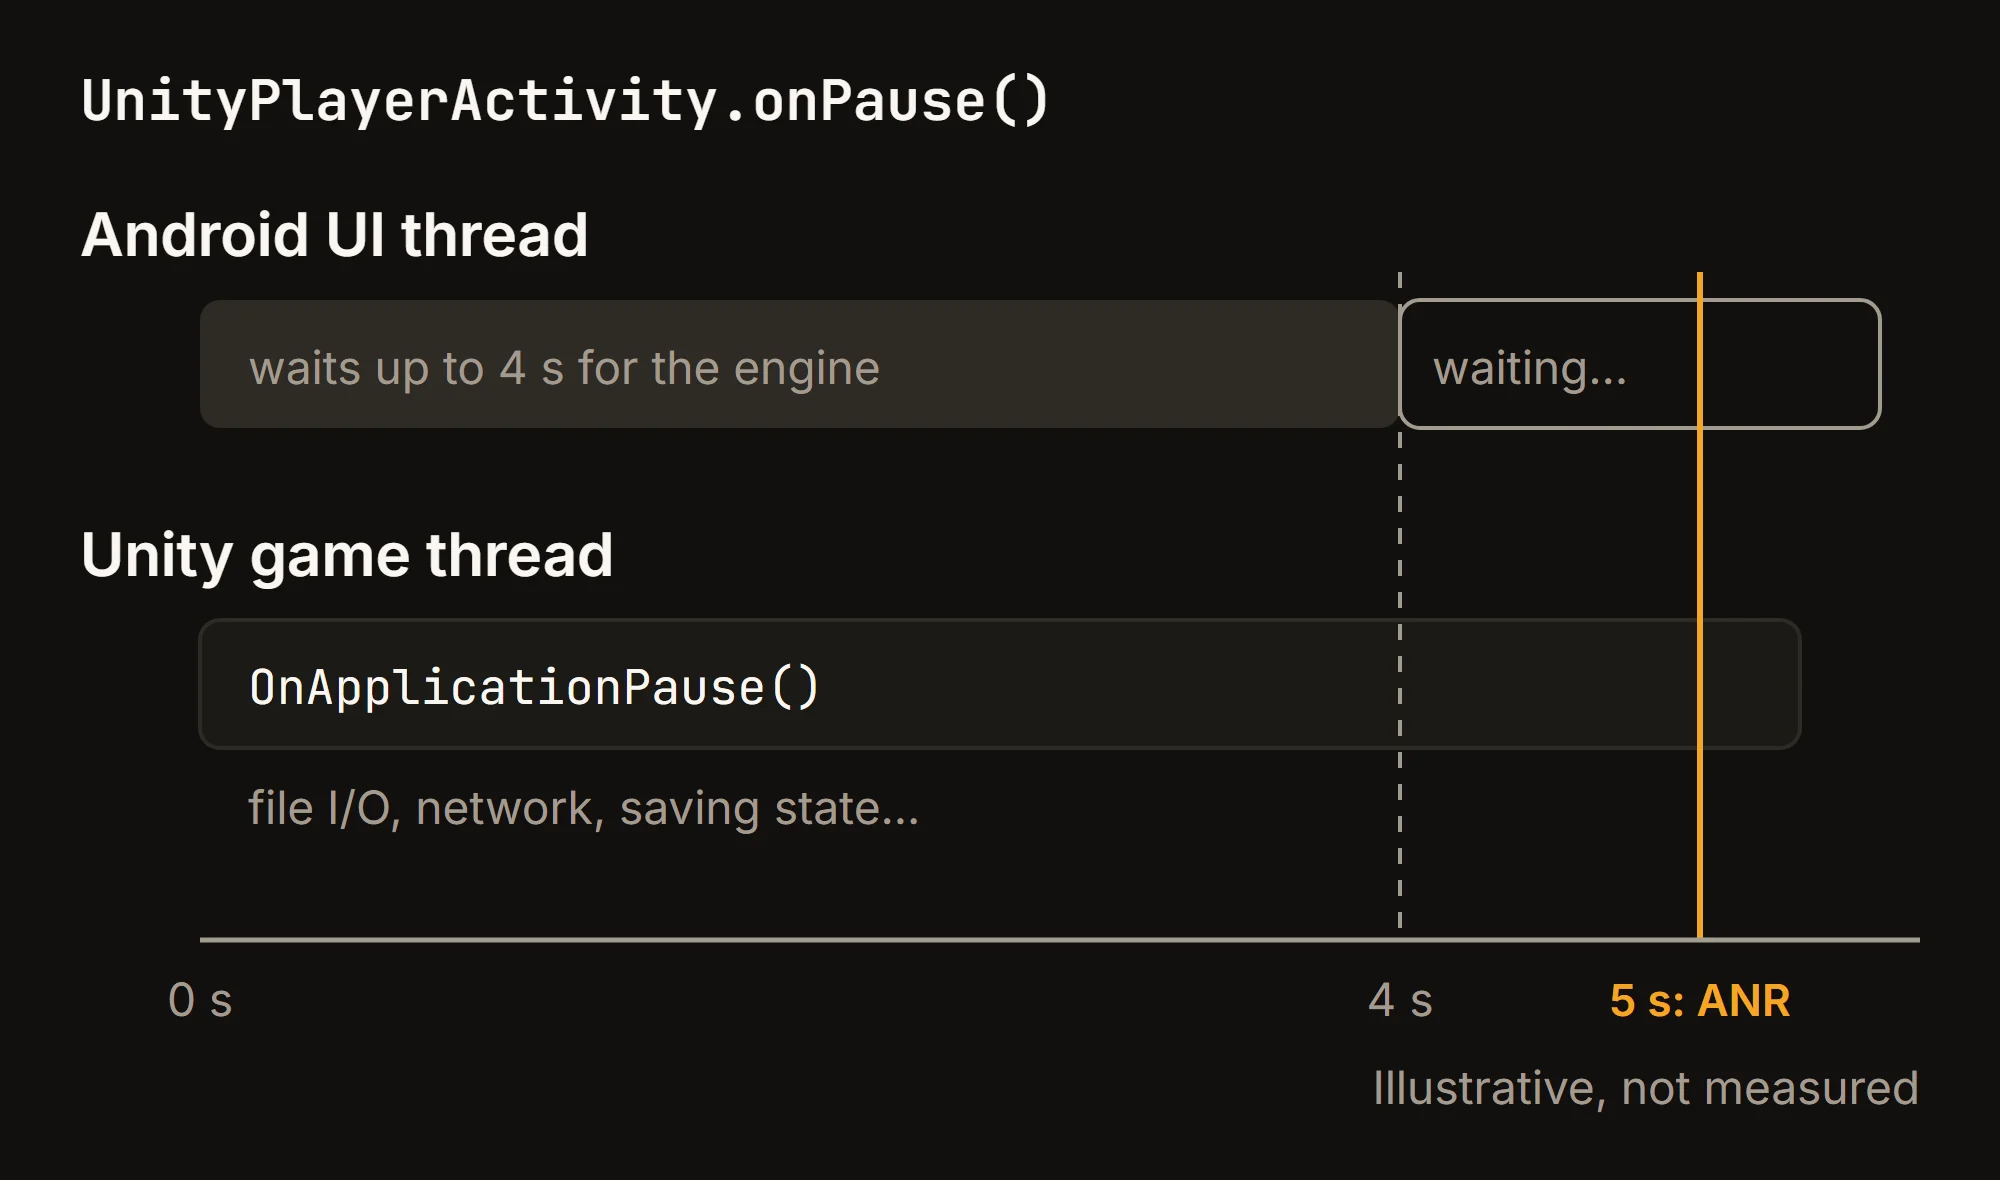
- Unity pause: when
UnityPlayerActivityreceivesonPause(), the UI thread waits up to 4 seconds for the engine to stop. If the operation takes over 5 seconds, Android raises an ANR. KeepOnApplicationPauseandOnApplicationFocusshort: no file I/O, no synchronous network calls, and move heavy work to aTask. - UnitySendMessage blocked: messages a plug-in sends while the game is in the background are queued, then all dispatched on resume while the UI thread waits on a mutex. Send only the latest state, not every update.
- SDK binder calls: an Install Referrer SDK made a slow binder call on the UI thread. Update the SDK, or check it in Google's SDK Index.
- WebView: often from ads. Log when web content loads, shows and closes to find the provider responsible.
The reverse direction also matters. When Java code calls back into your game on the UI thread, AndroidApplication's InvokeOnUnityMainThread moves the work to Unity's main thread.
Finding the cause of an ANR
Start with the ANR clusters in Play Console: Android's diagnosis guide explains how to read their top suspected frames. If the stack is in libunity.so or libil2cpp.so, you need the symbols from the previous section.
To reproduce an ANR locally, Android writes traces to /data/anr/anr_* (or /data/anr/traces.txt on older releases). Pulling them requires adb root, so on a retail device use adb bugreport. In plug-in Java code, StrictMode catches accidental I/O on the main thread during development. When the cause may be the system rather than your app, record a trace with Perfetto.
Your own game can also tell you why its previous process died. ApplicationExitInfo requires Android 11 (API level 30), and Unity 6 exposes it as ApplicationExitInfoProvider. This sketch logs the last five exits at startup; in a real game, send them to your backend instead:
using UnityEngine;
using UnityEngine.Android;

public static class ExitReasonReporter
{
    public static void LogPreviousExits()
    {
        using var version = new AndroidJavaClass("android.os.Build$VERSION");
        if (version.GetStatic<int>("SDK_INT") < 30) return;

        // pid 0 returns records for every process of this package.
        var exits = ApplicationExitInfoProvider.GetHistoricalProcessExitInfo(
            Application.identifier, 0, 5);
        foreach (var exit in exits)
        {
            Debug.Log($"[ExitReasonReporter] Previous exit: {exit.reason}, {exit.description}");
            if (exit.reason == ExitReason.ANR) Debug.Log(exit.traceAsString);
        }
    }
}
Call it only in Android player builds (for example inside #if UNITY_ANDROID && !UNITY_EDITOR). The arguments follow Android's API: a pid of 0 ignores the process filter, and maxNum caps the number of records. The provider's SetProcessStateSummary lets you attach your own state, such as the current scene, so the next launch knows what the player was doing.
Memory kills and the low memory killer
The low memory killer daemon (lmkd) ends the least essential processes when memory runs short. It ranks them by oom_adj_score: background apps go first, and the foreground app only after the previous app, the launcher, services and perceptible apps. When that is still not enough, your game is next, and Google notes that "killing the foreground app looks like an application crash".
The exit reason is REASON_LOW_MEMORY, or ExitReason.LowMemory in Unity. Some devices report REASON_SIGNALED with SIGKILL instead, and ActivityManager's isLowMemoryKillReportSupported() tells you which. A Java OutOfMemoryError is a different case. It is a crash that happens when Java code goes over the per-app Java heap limit. In a Unity game, that means plug-ins, SDKs or a custom activity.
Do not rely on Android's warnings. Since Android 14, apps are no longer notified of the onTrimMemory levels RUNNING_MODERATE, RUNNING_LOW, RUNNING_CRITICAL, MODERATE and COMPLETE (see ComponentCallbacks2). Unity's Application.lowMemory maps to onLowMemory() and to onTrimMemory with TRIM_MEMORY_RUNNING_CRITICAL, so on Android 14 and later the second trigger no longer arrives.
Keeping memory under the limit in Unity
The fix for memory kills is a memory budget, not a callback. Google's guide to LMKs in Unity games recommends setting a budget and adding memory reporting, so that no release goes over it. Unity's Memory Profiler documentation gives a ceiling: "It's best practice to not use over 70% of the total physical memory available on a device." Its Total Resident on Device figure is the number to compare against that ceiling.
Google calls assets "the most impactful and actionable part of memory consumption". From the same guide:
- Textures: use ASTC compression, try larger blocks such as 8x8, and ship separate texture sets for low-end and high-end devices.
- Duplicates: find assets loaded twice with the Memory Profiler or a build report.
- Unloading: prefer
Resources.UnloadAssetfor specific assets. FrequentResources.UnloadUnusedAssetscalls cause CPU spikes and, with Addressables, "can unintentionally unload dynamically loaded bundles". - Plug-ins and SDKs: Unity does not track their allocations, so measure them in Android Studio's memory profiler.
With Addressables, every load needs a matching release. A released asset stays in memory until its whole AssetBundle unloads, so one forgotten handle can keep a bundle resident.
For a last line of defense, Application.memoryUsageChanged reports memory pressure. Android reports Medium, High and Critical, but with GameActivity only Critical. This handler frees caches when memory turns critical:
using UnityEngine;

public class MemoryPressureHandler : MonoBehaviour
{
    void OnEnable() => Application.memoryUsageChanged += OnMemoryUsageChanged;
    void OnDisable() => Application.memoryUsageChanged -= OnMemoryUsageChanged;

    void OnMemoryUsageChanged(in ApplicationMemoryUsageChange change)
    {
        if (change.memoryUsage != ApplicationMemoryUsage.Critical) return;

        Debug.LogWarning("[MemoryPressureHandler] Memory usage is critical, releasing caches");
        // Release what you own first: pooled objects, cached textures, Addressables handles.
        // Unity's own sample then calls this; it is slow, so keep it for this rare event.
        Resources.UnloadUnusedAssets();
    }
}
The managed heap is part of the same budget. The garbage collection post explains why it only grows and how to keep allocations down.
Checklist
Crashes
- Build with Debug Symbols set to Public or Debugging, and upload the symbols zip to Play Console for every release.
- Set IL2CPP Stacktrace Information to include file and line numbers.
- Keep every SDK up to date, and read Java crash stacks for the SDK that threw the exception.
ANR
- Keep
OnApplicationPauseandOnApplicationFocuswell under 4 seconds: no file I/O, no synchronous network calls. - Don't send many
UnitySendMessagecalls from a plug-in while the game is paused. - Update SDKs that show up in ANR stacks, and check them in Google's SDK Index.
Memory
- Set a memory budget below 70% of the device's physical memory on your lowest-end target, and check it every release.
- Compress textures with ASTC, remove duplicates and release every Addressables handle.
- Handle
Application.memoryUsageChangedat Critical, but don't count on it.
Monitoring
- Read
ApplicationExitInfoon the next launch to count memory kills and ANRs that never reach your crash list. - Watch the Play thresholds: 1.09% for crashes, 0.47% for ANRs, 8% on any single device model, and the 1% LMK rate.